1. EPS(Electric Power Steering)?
The EPS system is a system that enables the driver to quickly steer the car. The EPS system is an electromechanical device that rotates a tire by increasing the mechanical force provided by the driver to the steering wheel. The screen below provides a detailed description of the EPS system and a block diagram.
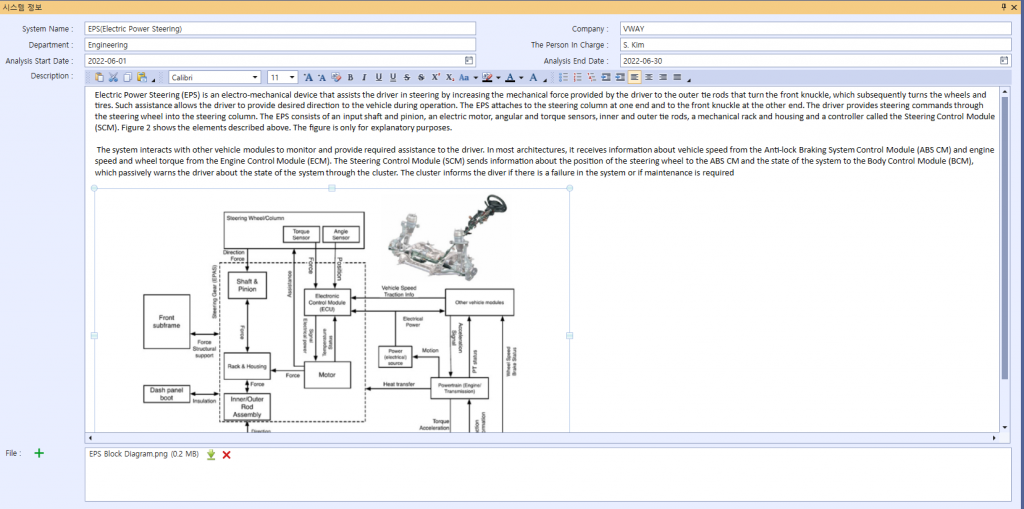
Picture 1. EPS System Information
2. STPA Analysis
2.1 Identify Losses and Hazards
Losses and hazards that can be defined in the EPS system are as follows:
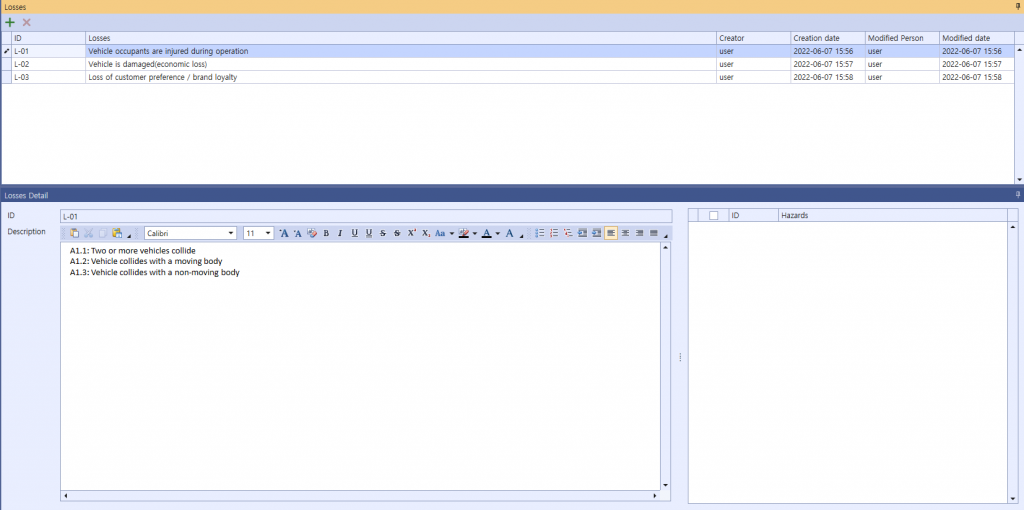
Picture 2. Identify Losses
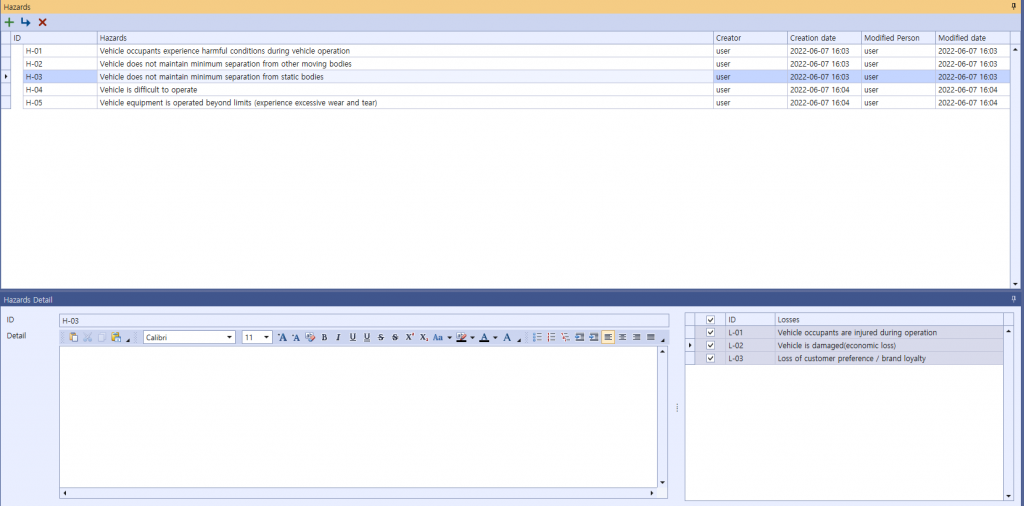
Picture 3. Identify Hazards
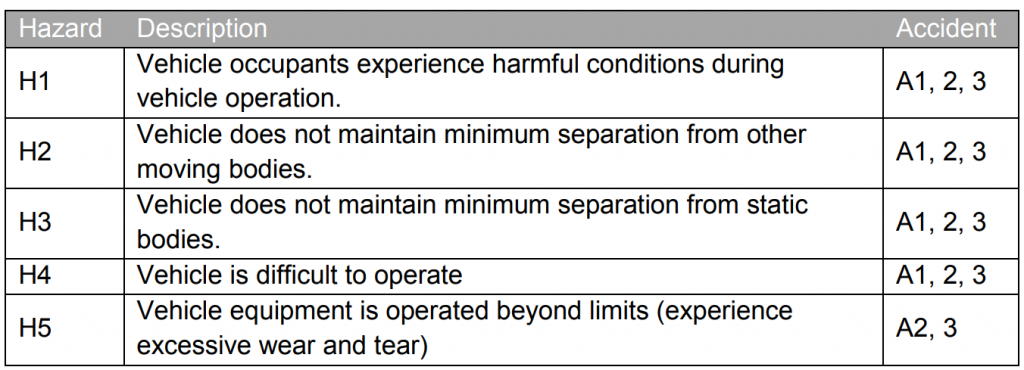
Table 1. Losses and Hazards Relationship
2.2 Control Structure Modeling
Once you have identified the loss and hazards above, you will now conduct modeling to show the relationship between the entities of the control structure of the EPS system. The control structure modeling relationship of the entities associated with the EPS system is as follows:
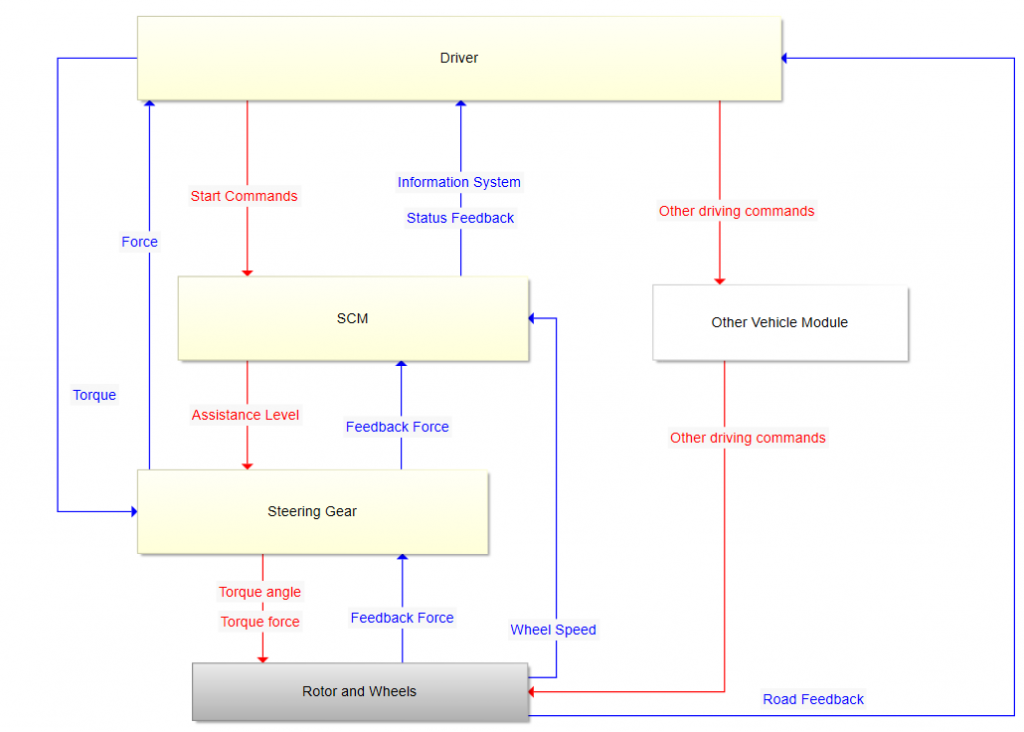
Picture 4. EPS System's Control Structure Model
2.3 UCA(Unsafe Control Action)
Once you have completed the control structure modeling for the EPS system, you can now derive the UCAs that may occur in the corresponding Control Action. The UCA that can be derived from the Control Action, where the SCM sends the Assistance level to the Steering Gear, is as follows:
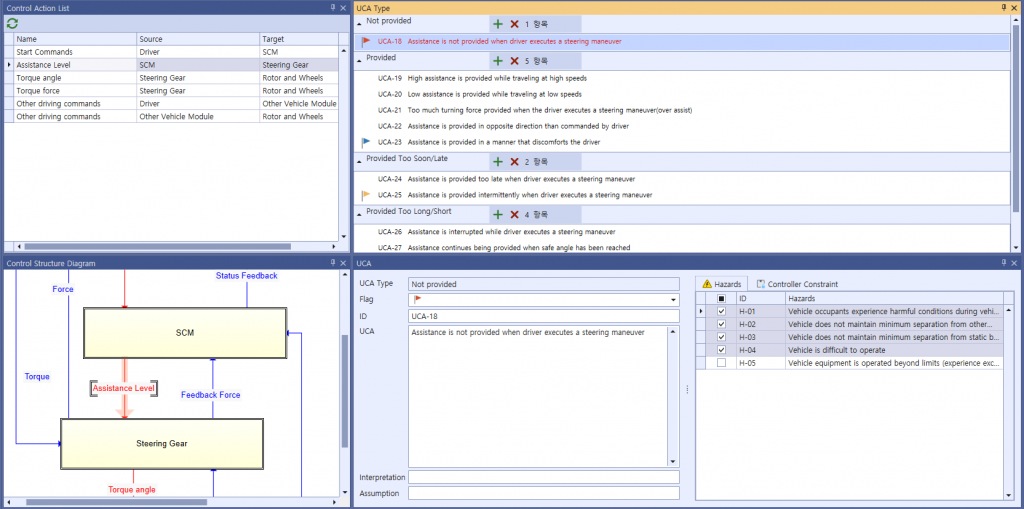
Picture 5. Assistance Level UCA
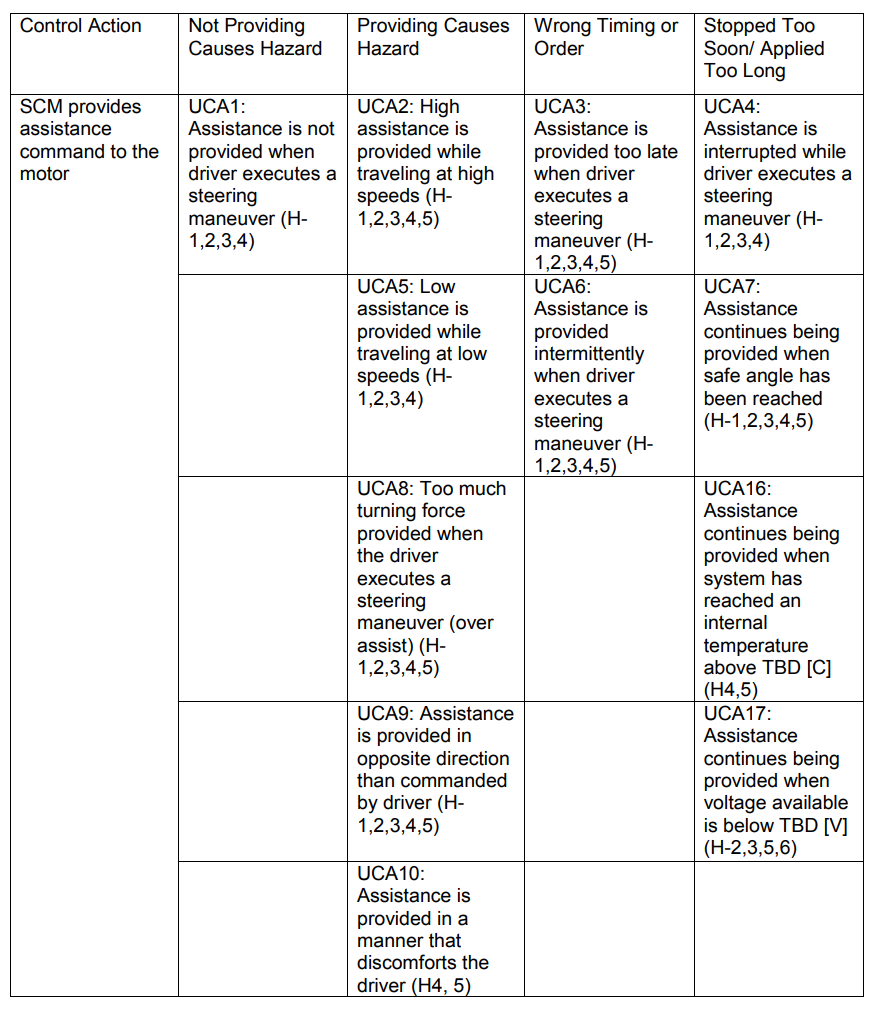
Table 2. Assistance Level UCA
2.4 Identify Loss Scenario
And You should identify potential loss scenarios through UCA. Below is UCA18 – Assistance is not provided when driver executes a steering maneuver‘s loss scenarios that identified.
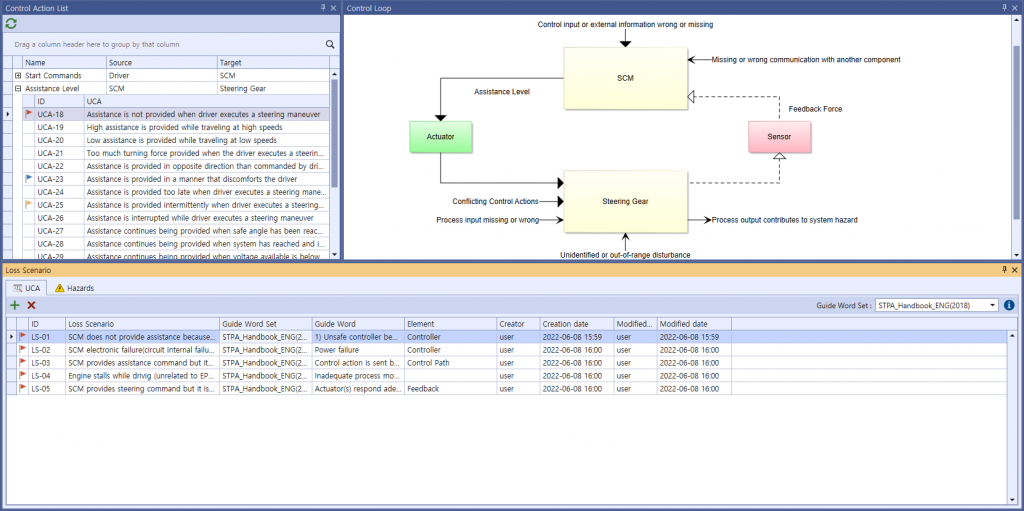
Picture 6. Identifying UCA18's Loss Scenarios
2.5 Derive Countermeasures and Requirements
After indentifying the loss scenario, some countermeasures or requirements were written for the solution. Depending on the loss scenario, various countermeasures and requirements may be required. You can also support the evidence for the solution by attaching the data.
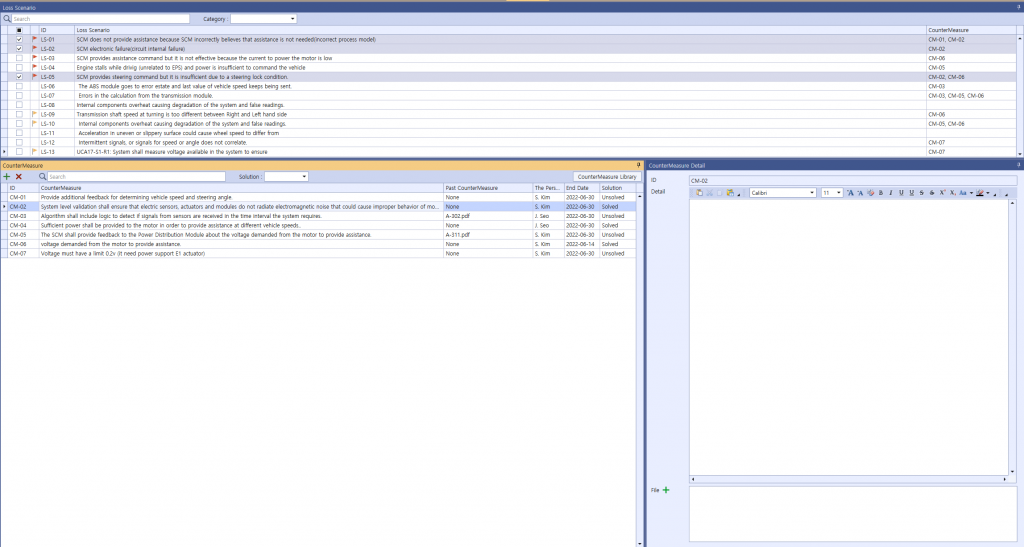
Picture 7. Writing Countermeasures & Requirements
3. Conclusion
When developing complex systems, such as automotive EPS systems, this study shows how STPA can be applied early in development to derive hazards from a new perspective and how the results can be utilized. In addition, FMEA and STPA are applied to the system respectively, and the application results and utility of each risk analysis method are also specified. FMEA techniques widely used in the automotive industry have limitations in identifying unsafe interrelationships, human error or user impact on the system. In this study, the STPA method was able to identify a wider range of accident causes than the FMEA analysis method, and the results of approximately 40 more causes compared to the FMEA technique can be found in the table below. In addition, the results of this study detail the requirements to be reflected in the design and the process of deriving detailed levels of requirements by repeating the control structure rather than performing STPA only once.
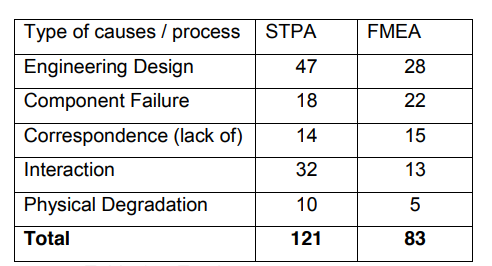
Table 3. STPA & FMEA Comparison
Rodrigo Sotomayor Martinez, "STPA of Electric Power Steering for Automotive Applications", 2015.6



1. EPS(Electric Power Steering)?
The EPS system is a system that enables the driver to quickly steer the car. The EPS system is an electromechanical device that rotates a tire by increasing the mechanical force provided by the driver to the steering wheel. The screen below provides a detailed description of the EPS system and a block diagram.
Picture 1. EPS System Information
2. STPA Analysis
2.1 Identify Losses and Hazards
Losses and hazards that can be defined in the EPS system are as follows:
Picture 2. Identify Losses
Picture 3. Identify Hazards
Table 1. Losses and Hazards Relationship
2.2 Control Structure Modeling
Once you have identified the loss and hazards above, you will now conduct modeling to show the relationship between the entities of the control structure of the EPS system. The control structure modeling relationship of the entities associated with the EPS system is as follows:
Picture 4. EPS System's Control Structure Model
2.3 UCA(Unsafe Control Action)
Once you have completed the control structure modeling for the EPS system, you can now derive the UCAs that may occur in the corresponding Control Action. The UCA that can be derived from the Control Action, where the SCM sends the Assistance level to the Steering Gear, is as follows:
Picture 5. Assistance Level UCA
Table 2. Assistance Level UCA
2.4 Identify Loss Scenario
And You should identify potential loss scenarios through UCA. Below is UCA18 – Assistance is not provided when driver executes a steering maneuver‘s loss scenarios that identified.
Picture 6. Identifying UCA18's Loss Scenarios
2.5 Derive Countermeasures and Requirements
After indentifying the loss scenario, some countermeasures or requirements were written for the solution. Depending on the loss scenario, various countermeasures and requirements may be required. You can also support the evidence for the solution by attaching the data.
Picture 7. Writing Countermeasures & Requirements
3. Conclusion
When developing complex systems, such as automotive EPS systems, this study shows how STPA can be applied early in development to derive hazards from a new perspective and how the results can be utilized. In addition, FMEA and STPA are applied to the system respectively, and the application results and utility of each risk analysis method are also specified. FMEA techniques widely used in the automotive industry have limitations in identifying unsafe interrelationships, human error or user impact on the system. In this study, the STPA method was able to identify a wider range of accident causes than the FMEA analysis method, and the results of approximately 40 more causes compared to the FMEA technique can be found in the table below. In addition, the results of this study detail the requirements to be reflected in the design and the process of deriving detailed levels of requirements by repeating the control structure rather than performing STPA only once.
Table 3. STPA & FMEA Comparison
Rodrigo Sotomayor Martinez, "STPA of Electric Power Steering for Automotive Applications", 2015.6